Using PlumeMasks.nc to Extract Daily SPM Values#
Starting with v0.4.0, each panache run writes a single PlumeMasks.nc file
alongside Results.csv. Starting with v0.5.0, this file stores one boolean
plume mask per river and one zone-wide union mask, for every processed
day, as a four-dimensional array with dimensions (time, river, lat, lon).
The river coordinate holds each zone’s river names plus a final 'ALL'
layer equal to the logical OR of all of that zone’s rivers on that day —
mirroring the per-(date, river) rows plus the river='ALL' aggregate row
in Results.csv (see Workflow Vignette).
This vignette demonstrates how to use PlumeMasks.nc together with the
original Sextant satellite files to recover the distribution of suspended
particulate matter (SPM) concentrations within the detected plume footprint on
any given day. The example uses one year of daily Gulf of Lion data (2010) from
the Sextant L4 SPM product.
1. Run panache to produce PlumeMasks.nc#
Run a standard Gulf of Lion batch for 2010:
{
  "zone": "GULF_OF_LION",
  "input_path": "/data/SEXTANT/SPM/2010/*.nc",
  "bathymetry_path": "/data/bathymetry/Bathy_data.pkl",
  "output_dir": "/data/panache-output/GULF_OF_LION/2010",
  "coast_shapefile": "/data/boundaries/gadm41_FRA_0.shp",
  "overwrite": false,
  "gif": false,
  "nb_cores": 4,
  "dynamic_threshold": false,
  "global_threshold_quantile": 0.95,
  "variable_name": "analysed_spim"
}
After the run completes the output directory contains:
GULF_OF_LION/2010/
├── Results.csv
├── PlumeMasks.nc     ← new in v0.4.0
├── manifest.csv
└── MAPS/
    └── ...
2. Inspect PlumeMasks.nc#
import xarray as xr

masks = xr.open_dataset("/data/panache-output/GULF_OF_LION/2010/PlumeMasks.nc")
print(masks)
<xarray.Dataset>
Dimensions:     (time: 365, river: 3, lat: 140, lon: 100)
Coordinates:
  * time        (time) datetime64[ns] 2010-01-01 ... 2010-12-31
  * river       (river) <U11 'Grand Rhone' 'Petit Rhone' 'ALL'
  * lat         (lat) float64 42.0 42.04 ... 47.6
  * lon         (lon) float64 3.0 3.04 ... 7.0
Data variables:
    plume_mask  (time, river, lat, lon) int8 15.3 MB ...
Attributes:
    long_name:     river plume mask
    flag_values:   [0 1]
    flag_meanings: no_plume plume
Each pixel is 1 where that river’s (or, on the 'ALL' layer, any river’s)
plume was detected on that day, and 0 otherwise. Days on which the scene was
too cloudy or no plume was found are represented as all-zero slices across
every river. The file is written with zlib compression by default (see the
mask_compression_level config option in Workflow Vignette), which
substantially offsets the size increase from the extra river dimension
since these masks are mostly zeros.
3. Extract the mask for one day#
Select a single day and river by indexing the time and river coordinates.
Use river="ALL" to recover the whole-zone footprint (the union of every
river that day), or a specific river name to isolate its own independently
detected plume — note that two rivers’ masks can overlap, so
mask_seine.sum() + mask_orne.sum() is not guaranteed to equal
mask_all.sum() (see the n_pixel_shared_with_other_rivers column in
Results.csv, Workflow Vignette):
import pandas as pd

day = pd.Timestamp("2010-03-15")
mask_all = masks["plume_mask"].sel(time=day, river="ALL")
mask_grand_rhone = masks["plume_mask"].sel(time=day, river="Grand Rhone")
print(mask_all.sum().item(), "plume pixels detected (zone total)")
print(mask_grand_rhone.sum().item(), "plume pixels detected (Grand Rhone only)")
4. Load the matching SPM file#
Use panache.io.load_map_data to load the Sextant file for the same day and
crop it to the Gulf of Lion bounding box:
from panache.io import load_map_data
from panache.utils import define_parameters

params = define_parameters("GULF_OF_LION")
lon_bounds = (min(params["lon_range_of_plume_area"]), max(params["lon_range_of_plume_area"]))
lat_bounds = (min(params["lat_range_of_plume_area"]), max(params["lat_range_of_plume_area"]))

spm = load_map_data(
    "/data/SEXTANT/SPM/2010/20100315-EUR-L4-SPIM-ATL-v01-fv01-OI.nc",
    lon_range=lon_bounds,
    lat_range=lat_bounds,
    variable_name="analysed_spim",
)
5. Extract in-plume SPM values#
plume_mask is produced at the native resolution of the input SPM product, on
the same grid as spm above, so it can be applied directly as a boolean mask:
spm_in_plume = spm.where(mask_day.astype(bool))
print(f"Mean in-plume SPM: {float(spm_in_plume.mean()):0.3f} g m⁻³")
print(f"Max  in-plume SPM: {float(spm_in_plume.max()):0.3f} g m⁻³")
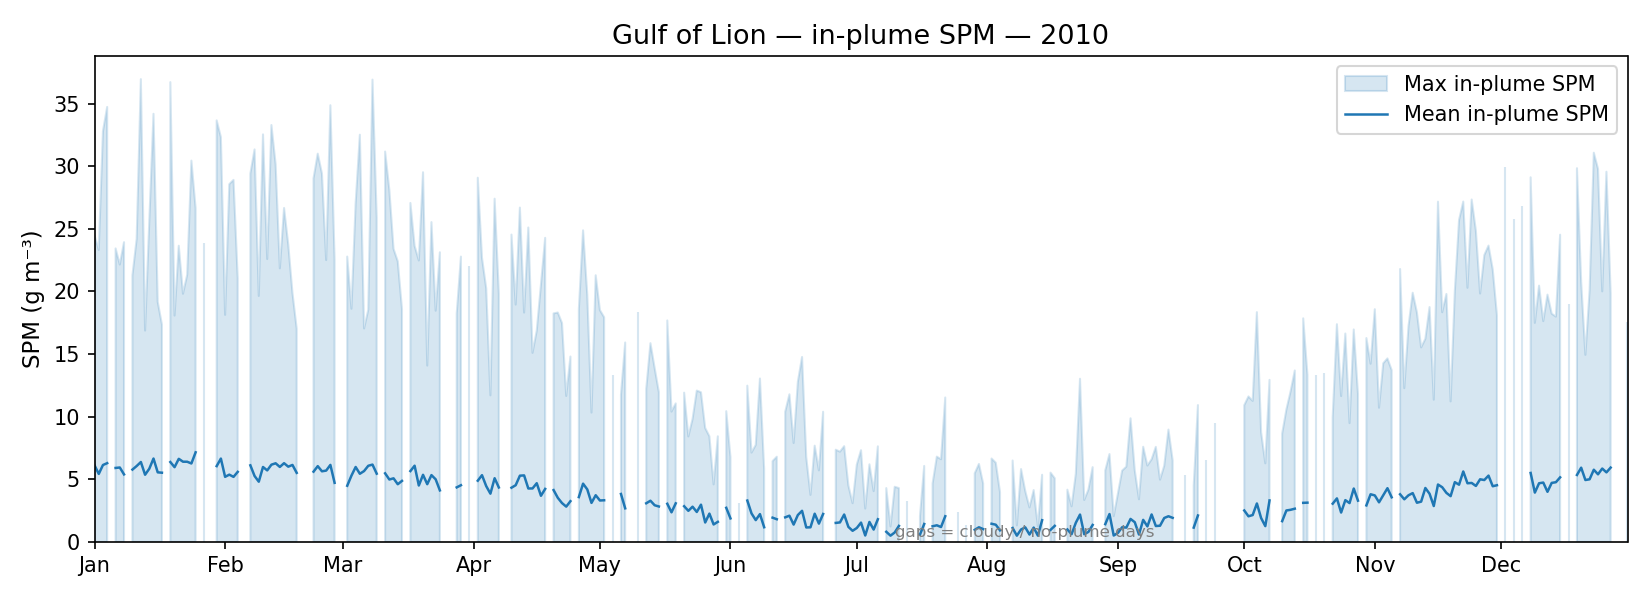
6. Build a daily time series for the full year#
Loop over all days in PlumeMasks.nc and extract summary statistics directly
from the original Sextant files. This example uses the river="ALL" layer to
build a whole-zone time series; select an individual river name instead (e.g.
"Grand Rhone") to build a per-river series.
from pathlib import Path
import pandas as pd
import numpy as np
import xarray as xr

masks = xr.open_dataset("/data/panache-output/GULF_OF_LION/2010/PlumeMasks.nc")
spm_dir = Path("/data/SEXTANT/SPM/2010")

records = []
for t in masks.time.values:
    day = pd.Timestamp(t)
    mask_day = masks["plume_mask"].sel(time=t, river="ALL").astype(bool)

    if not mask_day.any():
        records.append({"date": day, "mean_spm": np.nan, "max_spm": np.nan})
        continue

    fname = day.strftime("%Y%m%d") + "-EUR-L4-SPIM-ATL-v01-fv01-OI.nc"
    fpath = spm_dir / fname
    if not fpath.exists():
        records.append({"date": day, "mean_spm": np.nan, "max_spm": np.nan})
        continue

    spm = load_map_data(str(fpath), lon_range=lon_bounds, lat_range=lat_bounds,
                        variable_name="analysed_spim")
    vals = spm.values[mask_day.astype(bool).values]
    finite = vals[np.isfinite(vals)]
    records.append({
        "date": day,
        "mean_spm": float(np.mean(finite)) if finite.size else np.nan,
        "max_spm":  float(np.max(finite))  if finite.size else np.nan,
    })

daily = pd.DataFrame(records).set_index("date")
print(daily.head())
            mean_spm  max_spm
date
2010-01-01      3.21    18.74
2010-01-02       NaN      NaN   ← too cloudy (all-zero mask slice)
2010-01-03      2.88    15.03
2010-01-04      1.95     9.41
2010-01-05      2.07    11.22
NaN rows correspond to days when panache detected no plume (cloud cover or
below-threshold SPM). Those days already appear with zero plume area in
Results.csv; the NaN here simply propagates that into the SPM series.
7. Plot the seasonal cycle#
import matplotlib.pyplot as plt

fig, ax = plt.subplots(figsize=(12, 4))
ax.plot(daily.index, daily["mean_spm"], lw=1, label="Mean in-plume SPM")
ax.fill_between(daily.index, 0, daily["max_spm"], alpha=0.2, label="Max in-plume SPM")
ax.set_ylabel("SPM (g m⁻³)")
ax.set_title("Gulf of Lion — in-plume SPM — 2010")
ax.legend()
plt.tight_layout()
plt.savefig("gulf_of_lion_2010_spm_timeseries.png", dpi=150)
This approach works for any zone and any year. The only requirement is that
the Sextant files covering the same period are available on disk. PlumeMasks.nc
acts as a lightweight spatial index that can be applied to any gridded product
on a compatible grid without re-running the plume-detection algorithm.